
The 2024 Drag-and-Drive Landscape: Reflecting on the Numbers and Averages, A Record-Breaking 35 Events Scheduled, What the Season Might Hold
Social media can bring up lots of ideas, as well as “spirited” debates. With the huge upswing of drag-and-drive events in the last two years, several have speculated what it takes to be competitive in classes, and what the top 100 averages look like, has been mentioned a few times.

And it got me thinking about how the numbers look since Sick Week debuted, so I decided to take the bait and jump in!
Get geared up right for 2024 with Sick the Magazine merch! From hoodies to shirts, socks to our full line of Sick BBQ spices and sauces! Click here to see our full line-up, including the brand new Sick Summer offerings!

In 2022, the drag-and-drive event calendar expanded to eleven events, and after the first-ever Sick Week Presented by Gear Vendors Overdrive was in the books, the Quickest 100 averages for drag-and-drive cars was anchored by Joel Clark’s 10.188 average.
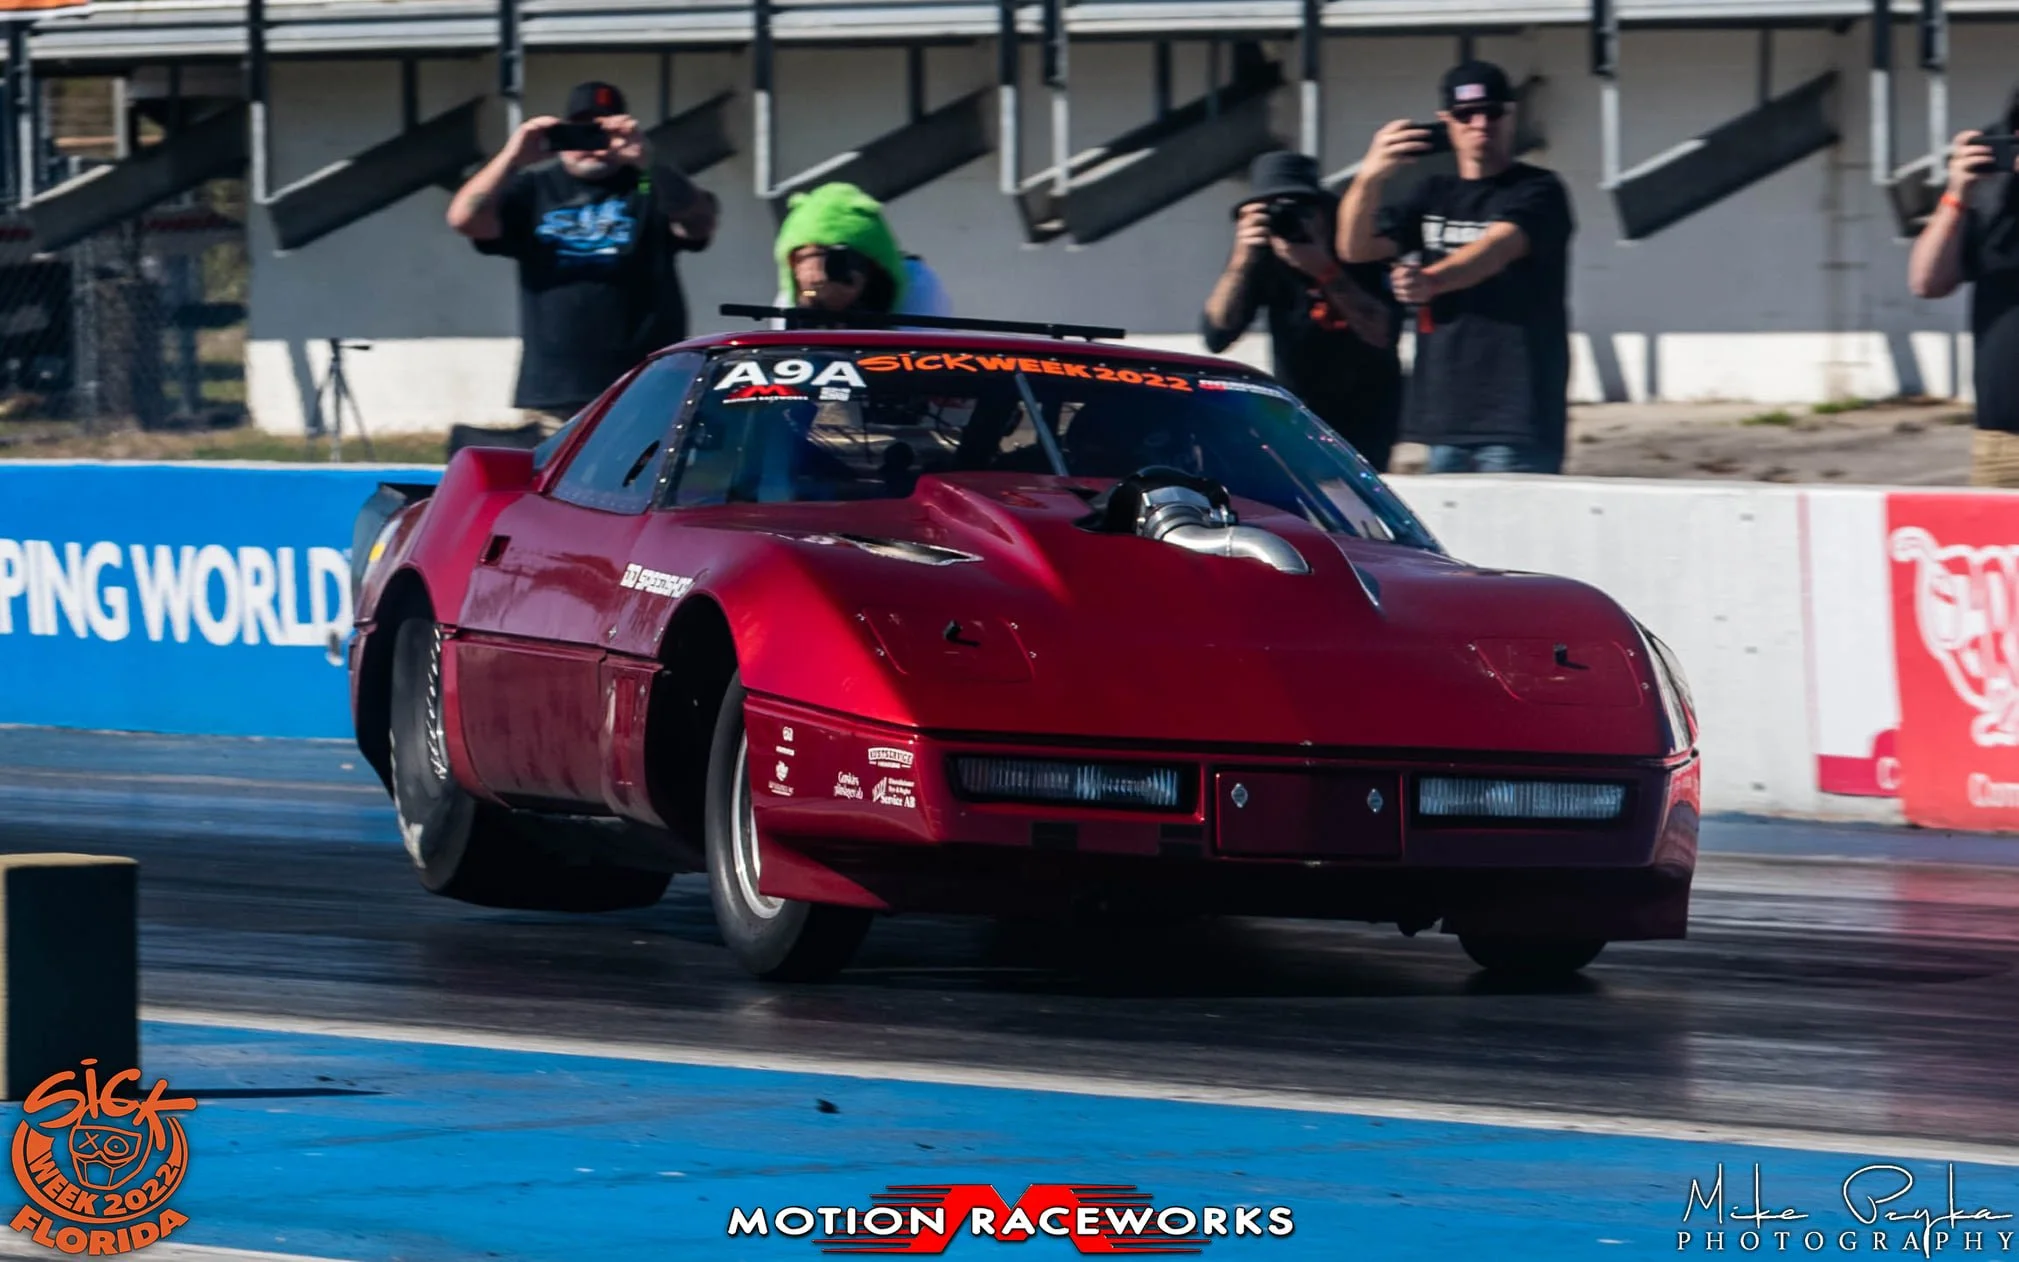
Three cars had a 6-second average, led by Stefan Gustafsson’s 6.677. Eight cars could brag about a 7-second average at the end of the week, 39 vehicles got their owners an 8-second average, 35 rides posted up a 9-second average, and a whopping 57 cars finished with an average between 10.00 and 10.99. So a total of 85 vehicles finished with an average quicker than 10-seconds, and once you add in the 10-second cars, you’re at a total of 142, just slightly more than half of the 273 that finished Sick Week 2022.
By the end of the year, the overall leading average was held by Tom Bailey at 6.583 with Michael Westburg close behind at 6.586, and the top 100 average bump spot was held by Wayne Baker.
The number of cars earning a 6-second average had increased from three to seven by the end of the year, while the 7-second rides had increased to seventeen. The rest of the top 100 field would be in the 8-second average group, with an 8.958 from Baker’s ’63 Chevy Nova holding the number 100 spot.

By the start of 2023, the drag-and-drive event listing had more than doubled to 23 offerings. By the time Sick Week was underway, it was 24 events, and by April it was a staggering 30 events! The second annual Sick Week had the following breakdown on averages:
- 4 cars averaging in the sixes with Michael Westburg’s 6.464 the best of the bunch.
- 12 cars completed the week with a 7-second average.
- 34 cars finished the event with an 8-second average.
- 37 vehicles had a 9-second average at the end of Sick Week.
- 32 competitors had earned a 10-second average, with Cooper Bogetti’s 10.32 average holding the bump spot for the top 100.

Comparing the numbers to 2022, the number of vehicles with a single digit average had risen from 85 to 87, and with the 10-second cars added into the total, the number would be 119, slightly less than half of the 240 competitors that completed Sick Week (twelve of them in the new Rowdy Radial eighth-mile class).
Nine months later, the top 100 average list for the 2023 season would still see Westburg’s 6.46 at the top of the heap, with five more vehicles joining him with a 6-second average. The 7-second average chunk had grown from twelve to thirty-one rides, and the remaining balance of 63 spots earning an 8-second average, anchored by veteran Mark Sussino’s 8.741.

By the beginning of the third installment of Sick Week this year, the drag-and-drive event offerings had expanded to 35 choices.
The results would breakdown on averages as:
- 4 cars averaging in the sixes, led by Brett LaSala and his 6.34 average.
- 15 cars completed the week with a 7-second average.
- 37 vehicles finished the event with an 8-second average.
- 39 drivers landing in the 9-second average category.
- 45 competitors garnered a 10-second average by the end of the week, with Richie Webb’s 10.20 average holding the 100th spot.
Looking at the numbers, the number of single-digit averages continued to rise, with 95 competitors completing the task quicker than 10.00 during Sick Week this year, the highest count in three years. Adding in the 10-second averages, the count would be 140 competitors, more than half the field of 258 that completed the week.
So, similar to the number of events each year, the number of single digit cars continues to increase. Even though I thought the number of events would remain constant in 2024, the number has increased by five instead.
So the safe bet, based on evidence, would be the number of single-digit averages will continue to increase by the end of the year, and the top 100 average bump be quicker than the 8.74 that the 2023 drag-and-drive yielded.
Written by Derek Putnam. Photos courtesy of Sick the Magazine and Motion Raceworks.
If you have thoughts / feedback / ideas, please e-mail us at derek@sickthemagazine.com